Abstract
Background: Vaccinations required for school attendance have increased nearly threefold since the 1950s, now targeting 17 infectious diseases. However, the impact of the expanded schedule on children’s overall health remains uncertain. Preliminary studies comparing vaccinated and unvaccinated children have reported that the vaccinated are significantly more likely than the unvaccinated to be diagnosed with bacterial infections, allergies, and neurodevelopmental disorders (NDDs). The objective of this study was to determine the association between vaccination and NDDs in 9-year-old children enrolled in the Medicaid program. The specific aims were to test the hypothesis that: 1) vaccination is associated with autism spectrum disorder (ASD) and other NDDs; 2) preterm birth coupled with vaccination increases the odds of NDDs compared to preterm birth without vaccination; and 3) increasing numbers of vaccinations are associated with increased risks of ASD.
Methods: The study population comprised children born and continuously enrolled in the Florida State Medicaid program from birth to age 9. Vaccination uptake was measured by numbers of healthcare visits that included vaccination-related procedures and diagnoses. Cross-sectional analyses were performed to calculate prevalence odds ratios (Aims 1-2). A retrospective cohort design was used to compute relative risks specifically of ASD (Aim 3).
Results: The analysis of claims data for 47,155 nine-year-old children revealed that: 1) vaccination was associated with significantly increased odds for all measured NDDs; 2) among children born preterm and vaccinated, 39.9% were diagnosed with at least one NDD compared to 15.7% among those born preterm and unvaccinated (OR 3.58, 95% CI: 2.80, 4.57); and 3) the relative risk of ASD increased according to the number of visits that included vaccinations. Children with just one vaccination visit were 1.7 times more likely to have been diagnosed with ASD than the unvaccinated (95% CI: 1.21, 2.35) whereas those with 11 or more visits were 4.4 times more likely to have been diagnosed with ASD than those with no visit for vaccination (95% CI: 2.85, 6.84).
Conclusions: These results suggest that the current vaccination schedule may be contributing to multiple forms of NDD; that vaccination coupled with preterm birth was strongly associated with increased odds of NDDs compared to preterm birth in the absence of vaccination; and increasing numbers of visits that included vaccinations were associated with increased risks of ASD.
Keywords
Introduction
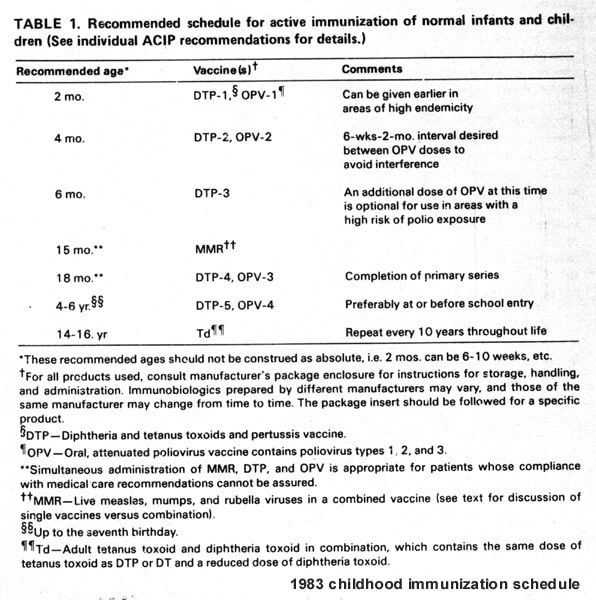
The current U.S. childhood vaccination schedule includes multiple doses of 17 vaccines given from birth to age 18 [1], representing a nearly threefold increase in vaccinations compared to the 1983 schedule [2]. During recent decades, dramatic increases have also been reported in the prevalence and associated costs of neurodevelopmental disorders (NDD), including autism spectrum disorder (ASD) and attention deficit hyperactivity disorder (ADHD) [3,4]. Controversy has long existed about links between NDDs and the receipt of vaccinations [5]. Rates of NDD increased more than tenfold during the 1980s [6] and one in six U.S. children was diagnosed with a developmental disability between 2009 and 2017 [7]. In 2018, 17.8% of U.S children were diagnosed with NDDs [8]. A more recent study based on two million publicly insured children enrolled at birth reported that by age eight nearly 24% were diagnosed with one or more NDDs, most commonly ADHD (14.5%), and risks were twofold higher for boys than girls (30.7% vs. 16.7%) [9]. Currently, the prevalence of ASD is estimated to be 1 in 36 children, or 2.8%, according to the Centers for Disease Control and Prevention’s (CDC) Autism and Developmental Disabilities Monitoring (ADDM) Network [10].
Explanations for rising rates of ASD include greater awareness of the diagnosis and its consequences [11] as well as exposure to agricultural chemicals [12]. However, the geographically widespread increases in ASD and ADHD suggests a role for an environmental factor to which virtually all children are exposed. One such factor is routine childhood vaccinations, since about 94 percent of children attending school in the U.S. are vaccinated and only about two percent are exempted from at least one vaccine [13]. High rates of vaccination have been maintained in the U.S. since the early 1980s [14]. Although vaccination is said to be safe and effective for the great majority of children, a legitimate question is whether the expanded schedule could be contributing in some way to rising rates of NDDs [15].
Recent reviews of the literature have found no evidence of increased risks of adverse events following routine vaccinations, including seizures [16] and autism [17]. But, as noted by the Institute of Medicine (IOM) [18], the impact of the expanded vaccination schedule on children’s overall health has remained unknown. This fact led the IOM to recommend evaluation of the schedule as a priority for research, and to include the identification of adverse health outcomes and populations potentially at increased risk for vaccine injury. Government-sponsored studies have not compared health outcomes in vaccinated versus completely unvaccinated children.
This uncertainty led the present authors to undertake such a comparison, based on mothers’ anonymous responses to an online survey [19,20] that included questions on pregnancy-related exposures, birth history, vaccinations, physician-diagnosed illnesses, medications, and the use of health services. A sample of 666 children was obtained, of which 261 (39%) were unvaccinated. As expected, the vaccinated were significantly less likely than the unvaccinated to have been diagnosed with chickenpox and pertussis. They were, however, significantly more likely than the unvaccinated to have been diagnosed with pneumonia, otitis media, allergies, and NDDs, defined as having one or more of the following: a learning disability, ADHD, or ASD (OR 3.7, 95% CI: 1.7, 7.9). Partially vaccinated children had intermediate odds of NDD, suggesting a dose-response relationship. Preterm birth was also associated with NDD, as expected. After controlling for the interaction of preterm birth and vaccination, the factors that remained significantly associated with NDDs were vaccination, nonwhite race, and male gender. In the absence of vaccination, preterm birth was not significantly associated with NDDs whereas preterm birth combined with vaccination was associated with a synergistic 6.6-fold increased odds of NDDs (95% CI: 2.8, 15.5).
Another recent study compared health outcomes among vaccinated and unvaccinated U.S. children born between 2005 and 2015, based on medical records from three medical practices. Vaccination before 12 months of age was significantly associated with developmental delays (OR 2.18, 95% CI: 1.47, 3.24). Extension of the time for a diagnosis from age 3 to more than 5 years of age increased the odds of developmental delay [21]. Vaccination before 1 year of age was also associated with increased odds of asthma (OR 4.49, 95% CI: 2.04, 9.88) and ear infections (OR 2.13, 95% CI: 1.63, 2.78). In a follow-up study based on survey data from respondents associated with three different medical practices, vaccinated children were significantly more likely than the unvaccinated to have been diagnosed with autism (OR 5.03, 95% CI: 1.64, 15.5) and ADHD (OR 20.8, 95% CI: 4.74, 91.2). Children who were vaccinated, bottle-fed and delivered by cesarean section had the highest overall rates of adverse health outcomes [22]. Other studies comparing health outcomes in vaccinated and unvaccinated children and adults have recently been reviewed [23].
The objective of the present study was to determine the association between vaccination and NDDs in 9-year-old children enrolled in the Florida Medicaid program during the years between 1999 and 2011. The specific aims were to determine whether: 1) vaccination is associated with autism spectrum disorder (ASD), hyperkinetic syndrome, epilepsy or seizures, learning disorders, encephalopathy, and tic disorders; 2) vaccination coupled with preterm birth increases the odds of NDDs compared to preterm birth without vaccination; and 3) increasing numbers of visits for vaccinations are associated with increased risks of ASD.
Methods
Study Designs
The research employed two different observational study designs: a cross-sectional study design for Aims 1 and 2, and a retrospective cohort study design for Aim 3. The cross-sectional design compared Florida Medicaid records of 9-year-old vaccinated children (i.e., records containing any codes associated with vaccination, including diagnostic ICD-9 codes, procedural CPT codes, or drug NDC codes) with those of unvaccinated children to test for significant differences in the odds of diagnoses with NDDs. Aim 3 used a retrospective cohort design to detect the relative risks of ASD diagnosis associated with different levels of exposure to vaccinations.
Definitions and Measures of Study Variables
The codes used to define the study’s variables listed in Table 1 comprised CPT codes (Current Procedural Terminology), ICD-9 codes (International Classification of Diseases) and NDC codes (National Drug Codes).

Table 1.
Birth Status, Exposure, and Outcome Identification Codes.
Full-term and Preterm Children enrolled in the Medicaid Program
A child enrolled in the Florida Medicaid program at birth was identified by at least one live birth ICD-9 CM (Clinical Modification) codes. For example, V30.00 is the code for “single liveborn in hospital without cesarean section.” Preterm birth, defined as a gestational age of < 37 weeks, is identified by at least one of the ICD-9 codes for this condition. For example, ICD-9 number 765 is the code for “Disorders relating to short gestation and low birthweight.”
Exposures – Quantifying Vaccination Status
Vaccinated children are defined as having any healthcare visit with one or more vaccination-related codes noted in their Medicaid claims records. No data were available at the individual level on numbers of specific vaccines. A visit with vaccination is a billing claim with at least one vaccine-related code recorded in a patient’s medical record on a given day. Vaccinations administered to infants and children in the Florida Medicaid program are identified by the CPT, ICD-9 CM or NDC codes used by providers for billing and reimbursement. For example, CPT code 90708 is billing code for “administration of the measles and rubella virus vaccine, live, for subcutaneous use.” Vaccination-related codes were used to identify vaccinated and unvaccinated children for all three aims of the study. In total, 326 vaccine-related CPT, ICD-9, and NDC codes could be used by providers for billing and reimbursement. The comprehensive list of codes was used to classify children correctly as vaccinated or not and to reduce misclassification. All possible vaccination codes, including those for vaccines given only to adults and used for tropical diseases, were used to screen the data. Unvaccinated children are defined as those without claims records for visits containing any vaccination-related code. For a complete list of vaccination-related codes see Appendix A.
Outcomes – Neurodevelopmental Diagnoses
A child with a neurodevelopmental disorder (NDD) is identified by having one or more of the following diagnoses: autism spectrum disorder (ASD), hyperkinetic syndrome of childhood, epilepsy or seizures, learning disorders, encephalopathy, and tic disorders. Learning disorder is identified by the use of speech and language services, as noted by the inclusion of code V57.3 in the individual’s claims records. The ICD-9-CM diagnostic codes for each type of condition are listed in Table 1.
Data Source and Analytical Database
The data used in the study were obtained from DEVEXI, an integrated health and medical research platform for generating epidemiological studies [24]. Individual-level data include Florida Medicaid procedure records, medications, diagnosis codes, demographics, medical and dental claims, costs for all procedures, treatments, and drugs. Visit-level data include Current Procedural Terminology (CPT), International Classification of Diseases (ICD-9), and National Drug Codes (NDC).
Florida Medicaid is the fourth largest Medicaid population in the nation. In 2019, approximately 4 million Floridians were enrolled in Medicaid, which included 63 percent of birth deliveries and 47 percent of children in the State [25]. DEVEXI’s integrated Florida Medicaid claims dataset includes all individuals enrolled in Florida Medicaid during the 22-year period from July 1, 1990, to June 30, 2012.
Individuals in the database cannot be personally identified and are represented by a unique alphanumeric code for tracking and linking records across providers and databases. The unique identifier allows data from the same individual to be linked across multiple visits and multiple providers, integrated, and supplemented with other data and pooled for generating new studies. This identifier enables non-duplication and prevents multiple counting of an individual if the individual has a specific condition but has multiple diagnostic codes.
The DEVEXI platform is compliant with the Health Insurance Portability and Accountability Act of 1996 (HIPAA) and is certified as meeting the requirements of data de-identification for protected health information. It is also certified by Westat as meeting the U.S. government’s guidelines for data de-identification, data safety, and data security, and is powered by Amazon Redshift to run complex analytic queries in the cloud. The data de-identification process accords with the 2012 Office for Civil Rights (OCR) document [26]. OCR recommends removal of 18 types of patient identifiers; these include names, specific geographical locations, pertinent dates, phone numbers, vehicle identifiers, fax numbers, device identifiers, email addresses, web universal resource locators, social security numbers, internet protocol (IP) addresses, medical record numbers, biometric identifiers, health plan beneficiary numbers, full face photographs, account numbers, other identifying numbers, and certificate/license numbers. The research reported in this paper was based on Medicaid claims data, carried out in accordance with all relevant guidelines and regulations, and there was no requirement for institutional review board and/or licensing committee approval or for informed consent.
Additional information about the creation of the study variables creation is contained in the following appendices and includes the reproducibility of Florida Medicaid Data (Appendix B), steps for generating cohorts (Appendix C), event sequencing functionality (Appendix D), Florida vaccination trends (Appendix E), autism identification (Appendix F), non-vaccination codes (Appendix G) and vaccine components information (Appendix H).
Study Population Development and Description
The steps taken to build the Florida Child Medicaid database are shown in Figure 1. Children in the study were born between January 1, 1999 and December 31, 2002 and enrolled in Florida Medicaid from birth for 9 years (up to December 31, 2011). The age selection of 9 years is comparable to CDC’s use of 8-year-old children for monitoring the prevalence of ASD [10].
Figure 1 shows that 47,155 children (full-term and preterm) were fully enrolled in Medicaid for 9 years, according to Florida Medicaid claims data. Of these, 42,032 children (89.1%) had claims records showing one or more encounters involving vaccination (procedural, diagnostic or drug code) by 9 years of age. For 5,123 children (10.9%) there were no claims with codes regarding encounters involving vaccination. Within the study population, 5,009 (10.6%) children were born preterm.

Figure 1.
Steps to Generate the Study Population.
Tables 2-5 show the demographic characteristics of groups of children in the study. The characteristics include birth status (full-term and preterm), vaccination status, race, and gender.
Table 2 shows there was very little variability by year of birth in vaccination status, as detected using Florida Medicaid claims data. The overall percentage of unvaccinated 9-year-old children between 1999 and 2011 program was 10.9% and varied from 10.0 to 11.3% per year.

Table 2.
Vaccination Status by Year of Birth of Florida Medicaid Children born between 1999 to 2002 and Continuously Enrolled from Birth to Age 9.
Table 3 shows the study population demographics related to vaccination status, gender, and race. Overall, the study group included a higher proportion of males (53%) than females (47%), and African Americans comprised the major race group (39%) in the study as well as the highest percentage of unvaccinated children (15.8%).

Table 3.
Vaccination Status of the Study Population by Gender and Race.
Note: There were 278 children (0.6%) with a gender and/or race other than the listed categories. *The numbers of males and females were derived from the numbers in the categories of race by gender shown in the same table.
Tables 4 and 5 show the demographic characteristics of preterm and full-term children in the study population by race, gender, and vaccination status. The largest group of preterm births was African American (40%) (Table 4), consistent with the proportion of African Americans in the study population. African Americans also comprised the largest group of unvaccinated children (Table 5).

Table 4.
Preterm Birth Study Population by Vaccination Status, Gender, and Race. Note: There were 23 children (0.5%) with a gender and/or race other than the listed categories. *The numbers of males and females were derived from the numbers in the categories of race by gender shown in the same table.
Tables 4 and 5 show virtually no demographic differences between preterm and full-term children regarding vaccination status, gender, or race. Almost 90% of preterm and full-term children were vaccinated, the percent of males was slightly higher than females (53%), and the largest racial/ethnic group was African American (about 40%).

Table 5.
Full-Term Birth Study Population by Vaccination Status, Gender, and Race. Note: There were 255 children (0.6%) with a gender and/or race other than the listed categories. *The numbers of males and females were derived from the numbers in the categories of race by gender shown in the same table.
The distribution of various NDDs among all Medicaid-enrolled children as well as children born preterm and at-term is shown in Table 6. The data show that a disproportionate share of the overall NDD burden is borne by children born preterm. Overall, 2.6% of all Florida Medicaid children were diagnosed with ASD compared to 4.4% among those born preterm. A similar pattern of increased burden in the proportion of preterm children compared to term born children is seen in other NDDs, with differences ranging from 29% higher in preterm children for hyperkinetic syndrome to 210% higher for encephalopathy.

Table 6.
Percentage differences in NDDs in children born Full-Term and Preterm.
Statistical Analysis
For Specific Aims 1 and 2, associations between vaccination (i.e., visits that included vaccination) and NDDs were tested for significance using prevalence odds ratios and 95% CI. Odds ratios describe the strength of the association between two categorical variables measured simultaneously in a cross-sectional study. An odds ratio of 1.0 means that the odds of an event occurring, for example being diagnosed with ASD, are the same for the vaccinated (exposed) group and the unvaccinated (unexposed) group; that is, there is no association between vaccination and ASD. However, an odds ratio of 2.7 means that the odds of being diagnosed with ASD are 2.7-fold higher in the vaccinated compared to the unvaccinated group. Additionally, z scores were computed. A z score describes how far a value (such as an odds ratio) is from the mean. A z score of 0 means that it is on the mean. Under a normal distribution curve, a z score of 1 means that 68% of the data fall within 1 standard deviation; a score of 2 means that 95% fall within 2 standard deviations, and a score of 3 means that 99.7% fall within 3 standard deviations of the mean. Z scores above 3.0 are highly unusual.
For Aim 3, the association between vaccination (based on different levels of healthcare visits that included vaccinations) and ASD was tested in a retrospective cohort study design. Relative risks (RRs) of ASD were calculated using Yates-corrected chi-square tests, to compensate for deviations from the theoretical probability distribution, resulting in a smaller but more conservative estimate for the following levels of comparison: 1) one vaccination visit versus no vaccination visit; 2) 1-4 vaccination visits (the modal number in the study population) versus no vaccination visit; 3) 5 or more visits versus no vaccination visits; 4) 11 or more visits (the median number of visits with vaccination in the general Medicaid population), versus one visit; and 5) 11 or more visits versus no vaccination visit.
Since 17 percent of the children had no office visit that included vaccination-related billing codes by age 2 years, it was decided to increase the vaccination age-range to 5 years, which lowered the percent of children with no record of vaccination to 11 percent. Thus, the records of children from birth to age 5 years (60 months) were extracted to record numbers of visits with vaccinations, and of those ages 5 to 9 years (48 months) for a diagnosis of ASD. The sequence of vaccination and ASD was such that vaccination had to occur at least one day before the diagnosis of ASD, and the diagnosis had to be between ages 5 and 9. This time interval was set to determine the association between visits with vaccinations from birth to age 5 and subsequent diagnoses of ASD.
Results
Specific Aim 1: “Test the hypothesis that vaccination is associated with increased odds of specific NDDs (i.e., ASD, hyperkinetic syndrome, epilepsy or seizures, learning disability, encephalopathy, and tic disorders).”
The odds of being diagnosed with these NDDs were significantly higher for vaccinated than for unvaccinated children (Table 7). Overall, 27.8% of vaccinated children compared to 11% of unvaccinated children had been diagnosed with at least one NDD (OR 3.12, 95% CI: 2.85, 3.41; p < 0.0001). The prevalence odds ratios for the outcomes ranged from 2.7 to 6.8, indicating significant differences in the likelihood of being diagnosed with an NDD between vaccinated and unvaccinated children. The z scores ranged from 4.4 to 24.7 standard deviations from the mean, also indicating large differences in outcomes for the two groups of children. Figure 2 depicts the odds ratios of NDDs by vaccination status in 9-year-old Medicaid children.

Table 7.
NDD Health Outcomes by Vaccination Status in Nine-Year-Old Children.

Figure 2.
Odds Ratios of NDDs by Vaccination Status in 9-year-old Medicaid children.
Specific Aim 2: “Test the hypothesis that preterm birth combined with vaccination is associated with increased odds of NDDs compared to preterm birth without vaccination.”
Among the 5,009 children born preterm, 4,492 (89.7%) were vaccinated and 517 (10.3%) were unvaccinated. Table 8 indicates that the odds of being diagnosed with all but one of the NDDs (tic disorders) were significantly higher for children born preterm and vaccinated than those born preterm and unvaccinated. In fact, no unvaccinated preterm infant was later diagnosed with a tic disorder. Among children born preterm, those who were vaccinated had significantly higher odds of being diagnosed with NDDs than the unvaccinated: ASD (OR 3.14, 95% CI: 1.54, 6.39), hyperkinetic syndrome (OR 3.0, 95% CI: 2.25, 3.99), epilepsy or seizures (OR 4.17, 95% CI: 2.77, 6.28), learning disorders (OR 9.84, 95% CI: 3.14, 30.84), and encephalopathy (OR 7.12, 95% CI: 2.93, 17.31). Overall, among children born preterm, vaccinated children were over threefold more likely to have been diagnosed with at least one NDD compared to the unvaccinated (39.9% vs. 15.7%, p <0.0001; OR 3.58, 95% CI: 2.80, 4.57). Prevalence odds ratios indicated highly significant differences in the likelihood of diagnosis of NDDs between children born preterm and vaccinated versus those born preterm and unvaccinated. Figure 3 depicts the odds ratios of NDDs by vaccination status in 9-year-old Medicaid children born preterm.

Table 8.
NDDs by Vaccination Status in Nine-Year-Old Children born Preterm.

Figure 3.
Odds Ratios of NDDs by Vaccination Status in 9-year-old Medicaid Children Born Preterm.
Conversely, as shown in Table 9, aside from a significant difference in epilepsy or seizures (4.8% vs. 2.2%, p = 0.0003; OR 2.27, 95% CI: 1.45, 3.55), differences in NDDs between unvaccinated preterm children and unvaccinated children born at term were minor and not statistically significant: ASD (1.5% vs.1%, p = 0.2505; OR 1.56, 95% CI: 0.73, 3.32), hyperkinetic syndrome (10% vs. 8.4%, p = 0.0937; OR 1.29, 95% CI: 0.96, 1.74), learning disorders (0.6% vs. 0.4%, p = 0.5820; OR 1.41, 95% CI: 0.42, 4.79), encephalopathy (1% vs. 0.5%, p = 0.1298 ; OR 2.13, 95% CI: 0.80, 5.68), and tic disorders (0% vs. 0.1%, p = 0.7958; OR 0.68, 95% CI: 0.04, 12.16). In summary, whereas children born preterm and vaccinated had higher odds of being diagnosed with NDDs than those who were unvaccinated, children born preterm and unvaccinated typically had minor and nonsignificant differences in NDDs compared to unvaccinated children born at term.

Table 9.
NDDs in Unvaccinated Nine-Year-Old Children born Preterm vs. Full-term.
Specific Aim 3: “Test the hypothesis that increasing numbers of vaccination visits is associated with increased risks of ASD.”
A total of 41,033 children had one or more visits with vaccinations by 5 years of age. Numbers of children with different levels of vaccination visits by age 5 are shown in Table 10. Between 6,040 and 6,057 children aged 5 were classified as unvaccinated. Figure 4 depicts the association between increasing numbers of vaccination visits and the diagnosis of ASD.

Table 10.
Association between increasing numbers of vaccination visits and diagnoses of ASD among children born between 1999 and 2002 and enrolled in Medicaid for 9 years.
Note: Differences in the table in the numbers of children are minor (0.06% in vaccinated and 0.3% in unvaccinated), do not change the size of the proportions, and are due to the steps used to generate the retrospective cohort study design in DEVEXI (Appendices C and D).

Figure 4.
Relative risks of the diagnosis of ASD and increasing numbers of visits that included vaccinations.
First comparison: Children with just one visit that included vaccinations (N=6,816) were 1.7 times more likely to have been diagnosed with ASD than unvaccinated children (N=6,043) (1.5% vs 0.9%, p = 0.0019; 95% CI: 1.21, 2.35) (Table 10). The average age at the visit was one year and two weeks, and the average age of being diagnosed with ASD was 6 years and 5.3 months.
Second comparison: Children with 1-4 vaccination visits (50.5% of the vaccinated, N=20,727) were 1.9 times more likely to have been diagnosed with ASD than the unvaccinated (1.7% vs 0.9%, p = < 0.0001; 95% CI: 1.46, 2.59).
Third comparison: Children with 5 or more vaccination visits (49.5% of the vaccinated, N=20,306) were 2.7 times more likely to have been diagnosed with ASD than the unvaccinated (2.4% vs 0.9%, p < 0.0001; 95% CI: 2.07, 3.64).
Fourth comparison: Children with 11 or more visits (1.8% of vaccinated children, N=738) were 2.8 times more likely to have been diagnosed with ASD than those with only one vaccination visit (4.1% vs 1.4%, p <0.0001; 95% CI: 1.89, 4.22). Among those who had 11 or more vaccination visits, the average age of vaccination visit was 3 years and 9 months, the average number of visits was 11.7, and the average age of ASD diagnosis was 6 years and 4.3 months.
Fifth comparison: Children with 11 or more visits for vaccinations were 4.4 times more likely to have been diagnosed with ASD than unvaccinated children (4.0% vs 0.9%, p < 0.0001; RR 4.4, 95% CI: 2.85, 6.84).
In summary, increasing numbers of healthcare visits for vaccinations were associated with significant increases in the likelihood of diagnosis with ASD (Table 10).
Discussion
Based on the records of 47,155 children enrolled in the Florida Medicaid program from 1999 to 2011, the results of this study provide evidence of significant associations between visits for vaccinations and diagnoses of neurodevelopmental disorders (NDDs). Vaccinated children were significantly more likely than the unvaccinated to have been diagnosed with ASD, hyperkinetic syndrome, learning disorders, epilepsy or seizures, encephalopathy, and tic disorders, with odds ratios ranging from 2.7 for ASD, 5.2 for encephalopathy, and 6.3 for tic disorders.
Preterm birth coupled with vaccination was associated with significantly increased odds of all NDDs compared to those of unvaccinated preterm infants. Conversely, children born preterm and unvaccinated had generally minor and statistically insignificant differences in NDDs compared with children born at term and unvaccinated, except for epilepsy or seizures. These observations suggest that preterm infants may be especially susceptible to vaccination injury and potentially long-term adverse consequences.
The possibility of adverse effects of vaccination on preterm infants may have been obscured by the primary importance placed on vaccinations for preventing neonatal infections. Based on the assumed safety of vaccination, preterm newborns are vaccinated on the same schedule as children born at term [27]. The association between preterm birth and NDD [28, 29] could therefore be due in part to the accompanying vaccinations rather than to preterm birth itself.
Increasing numbers of vaccinations were associated with significantly increased risks of ASD. Children with just one vaccination visit were 1.7 times more likely to have been diagnosed with ASD than the unvaccinated, whereas those with 11 or more visits were 4.4 times more likely to have been diagnosed with ASD than those with no visit. The increasing risk of ASD associated with numbers of visits for vaccinations suggests that some component or components of vaccines have progressively adverse effects.
Studies have reported no significant difference in rates of ASD between children who received specific vaccines and those who did not [17]. Given the current expanded and accelerated vaccination schedule, a link between vaccination and ASD could be due to the cumulative impact of all preceding vaccinations rather than to a specific vaccine alone. ASD and other NDDs could be triggered by the last vaccination administered or by one or more of a series of vaccinations.
The science of vaccines has focused on protection against specific pathogens and specific vaccines, while the overall impact of the vaccination schedule on children’s health has been left unexplored. The results of this study add to a growing body of evidence raising concerns about the safety of the current vaccination schedule and its possible contribution to rising rates of neurodevelopmental disorders.
Strengths of the Study
The strengths of this study include: 1) representativeness related to NDD and preterm birth rates; 2) control of confounders; 3) access to comprehensive vaccination codes; 4) age of vaccination and diagnosis with an NDD; 5) counting the number of visits for vaccinations; 6) the interval between vaccination and NDD diagnosis; and 7) use of a novel dataset.
1. Representativeness regarding NDD and preterm birth rates. The large size of the study population (N=47,155) strengthens the statistical significance of the observed associations. The data are consistent with the results of preliminary assessment and validation conducted by the Florida Department of Health query system. Among 200,000 children born to Florida residents every year between 1999 to 2011, about 20,000 children (10%) were born preterm. Similarly, 10.6% (5,009/47,155 births) of the Florida Medicaid study population were born preterm. Among all children in the study population, 89.1% (42,032/47,155) were vaccinated (Table 2), as were 89.7% of the children born preterm (Table 4). The prevalence of at least one of the listed NDDs (ASD, ADHD, learning disorders, epilepsy/seizures, encephalopathy, and tic disorders) comprised 26% of the study population (12,261/47,155) (Table 7). A recent cohort study [9] based on 2 million publicly insured children enrolled at birth, showed that 24% had received a diagnosis of one or more NDDs by age 8. The prevalence of NDDs in the Florida Medicaid population (Table 7) tends to be higher compared to the Florida non-Medicaid population and the U.S. population in general. According to a 2012 University of Florida report [30], a higher number of at-risk children (based on a score of four or more points on the Healthy Start Infant Screening Tool) are born in Medicaid than in non-Medicaid organizations and are therefore in need of greater screening for developmental problems.
2. Control of Confounders. Possible confounding factors to the study’s conclusions include age, gender, and congenital anomalies. The results are adjusted for age by limiting the age group of children from birth to age 9 (108 months). Vaccinated and unvaccinated groups of children are comparable in gender, with a higher proportion of males (53%) than females (47%). Although the study could not exclude children with congenital anomalies due to technical difficulties, as explained in Appendix J #7, it is unlikely that the presence of children with congenital anomalies influenced the study findings. This is due to the large size of the study population (47,155) and the small percentage of children affected by these conditions. For instance, in 2003 only 377 (0.5%) children were born and enrolled in Florida Medicaid with these congenital conditions: Fragile X syndrome, Tuberous sclerosis, Angelman syndrome/other specified congenital anomalies, Down syndrome, DiGeorge syndrome, Neurofibromatosis Type 1 and 2, Prader-Willi syndrome, and Congenital Rubella Syndrome. This is further supported by data from Denmark [31], showing that only a small percentage of children are affected by these conditions (955/663,236 = 0.1%).
3. Access to comprehensive vaccination codes. In an early phase of the data analysis, 22% of children born in 2004 and enrolled in Florida Medicaid in the first year had no record of vaccination. It was unclear how much this was due to lack of access by DEVEXI to ICD-9 inpatient vaccine procedure codes. However, an analysis of Florida Medicaid data by the Geiers [32], performed using the set of all codes to define MMR vaccinations (including the ICD-9 inpatient vaccine procedure codes), revealed that these codes would have a minimal effect on the percentage of children with no record of vaccination. In this study, use of a comprehensive list of vaccine codes has helped to improve the accuracy of the results. Use of a more restricted set of codes, based on the recommended vaccination schedule, or only a limited number of codes, could have compromised the analysis by lowering the number of vaccinated children.
4. Age of vaccinations and NDDs. In most situations, vaccinations precede diagnoses of NDDs, with the first vaccination (Hepatitis B) recommended for the day of birth, and most subsequent vaccinations in the first year are followed by fewer in the second year. In Medicaid, 17% of children had no record of vaccination by age two years. In addition, only 44% of children had four or more visits with vaccinations by age two years. The average age of documentation of diagnosis of ASD in Medicaid is over 5 years. For these reasons, the first two aims of the study analyzed all children from birth to age 9 years for documentation of vaccinations and diagnoses of NDDs (all listed NDDs are usually diagnosed before nine years of age). For the third study aim, data were analyzed on all children from birth to age five years who received at least one or more visits with vaccinations (n=41,033), and from age five to age nine for a diagnosis of ASD. The four fewer years of follow-up in documentation of a visit with vaccinations (Table 7 and Table 10) increased the number of unvaccinated children by 18% (6,043 / 5,123) and reduced ASD diagnoses by 0.7% (2.6% versus 1.9%). However, the increase in unvaccinated children (who are in fact vaccinated but misclassified as unvaccinated), has a minimal effect on the overall findings of the study, with a difference in the proportions of ASD of only 0.2%: 1.1% versus 0.9% and 98.9% versus 99.1% (see Tables 6 and 10).
5. Counting numbers of vaccinations. The third and final aim was to test the hypothesis that receipt of increasing numbers of vaccinations is associated with increased risks of diagnosis of ASD. Since no data are available at the individual level on numbers of specific vaccines, vaccinated children are defined as those who had any healthcare visit with one or more vaccinations, based on Florida Medicaid claims. A visit with vaccination is a billing claim with at least one vaccine-related code recorded in a patient’s medical record on a given day. Vaccinations administered to infants in Medicaid are identified by CPT codes, ICD-9 CM codes, or NDC, which are used by providers for billing and reimbursement. Vaccination codes were used for all three aims of the study. Any vaccine code was sufficient to label a child as vaccinated. The recommended schedule up to age two years in 1999 involved 16 doses of 6 vaccines. It was initially planned to compare rates of the selected NDDs in three vaccination groups as a scoring method: a) those with no vaccinations, based on the absence of any vaccine code; b) those in the lowest 10th percentile of vaccinations; and c) those in the highest 10th percentile of vaccine codes. Even though there might be a minimal amount of misclassification in the groups (e.g., with some vaccinated children in the “unvaccinated” group), it was expected that this analysis would show significant differences between the groups in rates of the selected NDDs, if they existed. However, the average count of vaccines in DEVEXI summary statistics output was very low: about 2.5 by age one year and 2.9 by age two. Further inquiries revealed that the reason for the low number of vaccinations was that the count refers to healthcare visits/appointments that had at least one vaccine code. The plan of analysis was therefore changed to assess different levels of “visits with one or more vaccinations” rather than a scoring method of vaccination codes based on a schedule.
6. Time interval between visits with vaccinations and diagnoses of ASD. A time interval is not applicable to all the research aims. For the “dose-response” analysis (Aim 3), an appropriate time interval is set to show the effect of multiple visits with vaccinations on outcomes. The scientific literature is limited on the topic of vaccine adverse events, especially on the time interval between vaccination and adverse outcomes. A child receives multiple vaccines in early life and an adverse event could be diagnosed immediately or over the course of months. Limiting the time interval to days or weeks could exclude children who are diagnosed long after the exposures.
7. Use of a novel dataset. The authors were the first users to test and operate the initial version of DEVEXI (Personal communication from Mitch Praver, co-founder of DEVEXI, 07/19/2018). The DEVEXI team was helpful in introducing the authors to the system and provided technical assistance in the research.
Limitations of the Study
These include: 1) Medicaid billing claims as a research tool; 2) Validation of vaccine uptake; 3) Lack of geographical representativeness; and 4) Lack of full access to proprietary database.
1. Medicaid as a billing claims database has limitations as a research tool. As claims data are not medical records there could be coding errors that result in some children being misclassified in terms of diagnoses. For instance, although Hepatitis B vaccination is recommended and given on the day of birth, the first date of a visit with Hepatitis B vaccination may be several days after the day of birth. In the study population, the first date of a vaccination visit (mainly for Hepatitis B vaccination) would theoretically be January 1, 1999, but the first date of vaccination in Florida Medicaid is recorded several days after the day of birth. Considering this limitation, for Aim 3, the time interval of birth to age 5 was set to determine the association between visits with vaccinations and subsequent diagnoses of ASD.
2. Validation of vaccine uptake. Since reporting of vaccinations administered in Florida into the centralized immunization registry is voluntary, it is difficult to verify the accuracy of the proportion of completely unvaccinated children in Medicaid. Enumeration of the fully unvaccinated group of children was a key priority for the study. Questions were: Are there codes specific to non-vaccinations and if so, how many children are identified as unvaccinated? Are there children who are incorrectly classified as unvaccinated due to the absence of vaccination records in Medicaid? A series of ICD-9 codes representing children who were not vaccinated for specific reasons was identified (from V64.0 to V64.09, Appendix G). However, these non-vaccination codes were unhelpful in identifying unvaccinated children. Regarding the five codes pertaining to vaccinations not carried out for non-medical reasons (V64.00, V64.05, V64.06, V64.07, V64.09), there were 574 children born between 1999 to 2010 for whom one of these five codes had been used in infancy (there were no refusals of vaccinations for religious reasons). Among these children, some had other vaccinations in the same visit; some visited for trauma or other medical emergencies, and a particular vaccination was refused, so the refusal code was used. Some of the 574 refusals may also have received vaccinations before or after the date of a non-vaccination code.
Regarding the potential inability to capture all vaccinations administered, the rate of unvaccinated children in this sample is high compared to other groups and national averages. A complicating factor in classifying children in Medicaid as vaccinated is to determine the vaccinations administered outside of the Medicaid system through the cost-free Florida Vaccines for Children Program (VFC) and Florida Children’s Health Insurance Program (CHIP). Some of these vaccinations may not be documented in Medicaid claims data (Appendix I). Misclassification of vaccination status could occur if Medicaid children were vaccinated at a site that would not produce data captured in Medicaid claims data systems including private pay non-Medicaid medical providers, schools, free clinics or pharmacies. A federal telephone survey of Florida families carried out each year (Governor’s Task Force Report, 2008) on autism spectrum disorders suggested that about one percent of all 2-year-olds in Florida are unvaccinated [33]. Children of parents with lower education levels, income, and access to health services, in addition to those with medical contraindications, tend to receive fewer vaccines. Unvaccinated children are an inferred group because there is no medical code in claims data to identify them. Therefore, those who are vaccinated, based on the codes, are defined as the exposed group, and children in the remainder of the cohort are classified as unexposed or unvaccinated. It also means that if a code is missed, but happens to be a common code, children are misclassified as unvaccinated. As the number of years of Medicaid enrollment since birth increases, the number of unvaccinated children decreases. A comprehensive list of vaccine codes and continuous enrollment of children up to nine years helped to reduce misclassification of vaccinated children in unvaccinated children. Among the study population of 47,155 children of age nine years, 10.9% (5,123) were unvaccinated (Table 3).
3. Lack of geographical representativeness. Despite the large number of children in the dataset, these results may not be generalizable to all US children or representative of Medicaid children in other US states. Thus, generalizing the results to populations that were not included in this dataset should be carefully considered.
4. Lack of full access to proprietary database. For several reasons, ongoing access to the proprietary DEVEXI database was constrained and affected our ability to conduct additional validation analyses.
Conclusion
The findings of this study of children enrolled in the Florida Medicaid program between 1999 and 2011 include the following:
1. Vaccinated children were significantly more likely than unvaccinated children to be diagnosed with the following NDDs: ASD, hyperkinetic syndrome of childhood, epilepsy or seizures, encephalopathy, tic disorders, and learning disorders.
2. Increasing numbers of healthcare visits that included one or more vaccinations were associated with higher risks of diagnosis for ASD, suggesting a dose-response relationship.
3. Preterm birth and vaccination increased the odds of being diagnosed with all measured NDDs beyond the effects noted for only preterm birth and vaccination alone.
4. Children born preterm and unvaccinated were no more likely than children born at term and unvaccinated to be diagnosed with ASD, hyperkinetic syndrome, encephalopathy, tic disorders, and learning disorders. They did, however, have higher odds of seizures/epilepsy.
The results of this study add to a growing body of evidence suggesting that vaccination may be associated with significantly increased odds of various medical conditions, including NDDs. The evidence accumulated to date suggests that vaccination can precipitate unintended adverse outcomes and that cumulative exposure to vaccines, especially in preterm infants, may be associated with adverse neurological outcomes. New vaccines continue to be added to the federally recommended childhood vaccination schedule on the assumption that they will have no effect on health other than protection against the targeted pathogens. However, the findings of this study suggest that routine vaccination may be associated with NDDs appearing in early childhood. These results signal an urgent need for research to identify biological mechanisms and potential causal relationships be-tween individual vaccines, or combinations of vaccines, and genetic, epigenetic, environmental and other biologic risk factors associated with NDDs. In the meantime, planned additions to the schedule should be delayed until research to determine the safety of its impact on children’s overall health is completed.
Acknowledgments
Author Contributions: Conceptualization: A.R.M. and B.J.; methodology: A.R.M., B.J.; formal analysis: B.J.; writing—original draft preparation: A.R.M., B.J.; writing—review and editing: A.R.M., B.J.; project administration, A.R.M.; funding acquisition, A.R.M. Both authors have read and agreed to the published version of the manuscript.
Funding: This research was funded by the National Vaccine Information Center (NVIC.org). The publication cost of this study was partially offset by The National Vaccine information Center (NVIC.org) and by IPAK (ipaknowledge.org).
Conflicts of Interest: The authors declare no conflict of interest. The funder had no role in the design of the study, in the collection, analyses, or interpretation of data, in the writing of the manuscript, or in the decision to publish the results.
Institutional Review Board Statement: The study did not require ethical approval.
Supplementary Files
Appendices available for download at https://publichealthpolicyjournal.com/wp-content/uploads/2025/01/V6E1Mawson_Vaccination_and_NDDs_appendices.docx
References
1
Centers for Disease Control and Prevention. Birth-18 Immunization schedule. Child and Adolescent Immunization Schedule by Age. Recommendations for Ages 18 Years or Younger, United States, 2023. https://www.cdc.gov/vaccines/hcp/imz-schedules/child-adolescent-age.html
2
Centers for Disease Control and Prevention (1983). Recommended schedule for active immunization of normal infants and children 1983. https://www.cdc.gov/vaccines/schedules/images/schedule1983s.jpg
3
Cainelli E, Bisiacchi P. Neurodevelopmental Disorders: Past, Present, and Future. Children (Basel). 2022 Dec 24;10(1):31. doi: 10.3390/children10010031. PMID: 36670582; PMCID: PMC9856894. https://doi.org/10.3390/children10010031
4
Wolff JJ, Piven J. Predicting Autism in Infancy. J Am Acad Child Adolesc Psychiatry. 2021 Aug;60(8):958-967. doi: 10.1016/j.jaac.2020.07.910. Epub 2020 Nov 5. PMID: 33161062; PMCID: PMC8158398. https://doi.org/10.1016/j.jaac.2020.07.910
5
Conklin L, Hviid A, Orenstein WA, Pollard AJ, Wharton M, Zuber P. Vaccine safety issues at the turn of the 21st century. BMJ Glob Health. 2021 May; 6(Suppl 2):e004898. doi: 10.1136/bmjgh-2020-004898. PMID: 34011504; PMCID: PMC8137241. https://doi.org/10.1136/bmjgh-2020-004898
6
Rice C et al. Prevalence of Autism Spectrum Disorders — Autism and Developmental Disabilities Monitoring Network, Six Sites, United States, 2000. MMWR Surveillance Summaries. February 9, 2007 / 56(SS01);1-11. https://www.cdc.gov/mmwr/preview/mmwrhtml/ss5601a1.htm
7
Zablotsky B, Black LI, Maenner MJ, Schieve LA, Danielson ML, Bitsko RH, Blumberg SJ, Kogan MD, Boyle CA. Prevalence and Trends of Developmental Disabilities among Children in the US: 2009–2017. Pediatrics 2019; 144(4):e20190811.
8
Zablotsky B, Black LI. Prevalence of children aged 3–17 years with developmental disabilities, by urbanicity: United States, 2015–2018. National Health Statistics Reports, Number 139, February 19, 2020. US Department of Health and Human Services.
9
Straub L, Bateman BT, Hernandez-Diaz S, York C, Lester B, Wisner KL, McDougle CJ, Pennell PB, Gray KJ, Zhu Y, Suarez EA, Mogun H, Huybrechts KF. Neurodevelopmental Disorders Among Publicly or Privately Insured Children in the United States. JAMA Psychiatry, 2022 Jan 5. doi: 10.1001/jamapsychiatry.2021.3815. https://doi.org/10.1001/jamapsychiatry.2021.3815
10
Maenner MJ, Warren Z, Williams AR, et al. Prevalence and Characteristics of Autism Spectrum Disorder Among Children Aged 8 Years — Autism and Developmental Disabilities Monitoring Network, 11 Sites, United States, 2020. MMWR Surveill Summ 2023;72(No. SS-2):1–14. doi:10.15585/mmwr.ss7202a1. https://doi.org/10.15585/mmwr.ss7202a1
11
Wright J. The Real Reasons Autism Rates Are Up in the U.S. Sci Am 2017; March, 3. https://www.scientificamerican.com/article/the-real-reasons-autism-rates-are-up-in-the-u-s/ (Accessed February 9, 2022).
12
von Ehrenstein OS, Ling C, Cui X, Cockburn M, Park AS, Yu F, Wu J, Ritz B. Prenatal and infant exposure to ambient pesticides and autism spectrum disorder in children: population based case-control study. BMJ. 2019 Mar 20;364:l962. doi: 10.1136/bmj.l962. Erratum in: BMJ. 2019 Jun 25;365:l4032. https://doi.org/10.1136/bmj.l962
13
Centers for Disease Control and Prevention (2022a). Vaccination Coverage with Selected Vaccines and Ex-emption Rates Among Children in Kindergarten – United States, 2020-21 School Year. MMWR Apr. 22, 2022; 71(15: 561-568. https://www.cdc.gov/mmwr/volumes/71/wr/mm7116a1.htm
14
Hinman AK, Orenstein WA, Schuchat A. Vaccine-Preventable Diseases, Immunizations and MMWR – 1961-2011. MMWR October 7, 2011; 69(04): 49-57. https://www.cdc.gov/mmwr/preview/mmwrhtml/su6004a9.htm
15
Offit PA, Quarles J, Gerber MA, Hackett CJ et al. Addressing parents’ concerns: do multiple vaccines over-whelm or weaken the infant’s immune system? Pediatrics. 2002 Jan;109(1):124-9. doi: 10.1542/peds.109.1.124. https://doi.org/10.1542/peds.109.1.124
16
Gidengil C, Goetz MB, Maglione M et al. Safety of Vaccines Used for Routine Immunization in the United States: An Update. Comparative Effectiveness Review No. 244. Prepared by the Southern California Evidence-based Practice Center under Contract No. 290-2015-00010-I. AHRQ Publication No. 21-EHC024. Rockville, MD: Agency for Healthcare Research and Quality; May 2021. DOI: 10.23970/AHRQEPCCER244. https://doi.org/10.23970/AHRQEPCCER244
17
Mohammed S A, Rajashekar S, Giri Ravindran S, et al. Does Vaccination Increase the Risk of Autism Spectrum Disorder? Cureus 2022; 14(8): e27921. doi:10.7759/cureus.27921 https://doi.org/10.7759/cureus.27921
18
Institute of Medicine. The childhood immunization schedule and safety: Stakeholder concerns, scientific evidence, and future studies. 2013. The National Academies Press, Washington, DC Health Charts. Florida Department of Health, Division of Public Health Statistics & Performance Management. Births, Data Queries, Florida http://www.flhealthcharts.com. Accessed July 2019.
19
Mawson AR, Ray BD, Bhuiyan AR, Jacob B. Pilot comparative study on the health of vaccinated and unvaccinated 6- to 12-year-old U.S. children. J Transl Sci 2017; 3(3):1-12. doi: 10.15761/JTS.1000186. https://doi.org/10.15761/JTS.1000186
20
Mawson AR, Bhuiyan AZ, Jacob B, Ray BD. Preterm birth, vaccination and neurodevelopmental disorders: a cross-sectional study of vaccinated and unvaccinated children. J Transl Sci 2017; 3(3):1-8. doi: 10.15761/JTS.1000187. https://doi.org/10.15761/JTS.1000187
21
Hooker BS, Miller NZ. Analysis of health outcomes in vaccinated and unvaccinated children: Developmental delays, asthma, ear infections and gastrointestinal disorders. SAGE Open Med 2020; 8:2050312120925344. doi: 10.1177/2050312120925344 https://doi.org/10.1177/2050312120925344
22
Hooker BS, Miller NZ. Health effects in vaccinated versus unvaccinated children. J Trans Sci 2021; 7: 1-11. doi: 10.15761/JTS.1000459. https://doi.org/10.15761/JTS.1000459
23
Kennedy RF Jr., Hooker BS. Vax-Unvax: Let the Science Speak. Skyhorse Publishing, New York, 2023.
24
DEVEXI. Conveying advanced health information. 2022 http://devexi.s3-website-us-east-1.amazonaws.com/ (Last accessed February 9, 2022. The company is no longer in existence).
25
Kidder B. Deputy Secretary for Medicaid, The Florida Medicaid Program. Presented to: Senate Health Policy Committee January 7, 2019. Page 8 of https://ahca.myflorida.com/content/download/5854/file/SenateHealthPolicy_010419.pdf
26
Office for Civil Rights (OCR). Guidance Regarding Methods for De-identification of Protected Health In-formation in Accordance with the Health Insurance Portability and Accountability Act (HIPAA) Privacy Rule, 2012. https://www.hhs.gov/sites/default/files/ocr/privacy/hipaa/understanding/coveredentities/De-identification/hhs_deid_guidance.pdf (Accessed August 1, 2022).
27
Gagneur A., Pinquier D, Quach, C. Immunization of preterm infants. Human Vaccines & Immunotherapeutics 2015 11(11), 2556–2563. doi: 10.1080/21645515.2015.1074358. https://doi.org/10.1080/21645515.2015.1074358
28
Blencowe H, Lee AC, Cousens S, Bahalim A, Narwal R, Zhong N, Chou D, Say L, Modi N, Katz J, Vos T, Mar-low N, Lawn JE. Preterm birth-associated neurodevelopmental impairment estimates at regional and global levels for 2010. Pediatr Res 2013 Dec;74 Suppl 1(Suppl 1):17-34. doi: 10.1038/pr.2013.204. PMID: 24366461; PMCID: PMC3873710. https://doi.org/10.1038/pr.2013.204
29
Crump C, Sundquist J, Sundquist K. Preterm or Early Term Birth and Risk of Autism. Pediatrics 2021 Sep;148(3):e2020032300. doi: 10.1542/peds.2020-032300. Epub 2021 Aug 11. PMID: 34380775. https://doi.org/10.1542/peds.2020-032300
30
University of Florida (2012). Florida Medicaid Maternal and Child Health Status Indicators Report: 2006–2010. Presented to the Florida Agency for Health Care Administration, June 2012.
31
Hviid A, Hansen JV, Frisch M, Melbye M. Measles, Mumps, Rubella Vaccination and Autism: A Nationwide Cohort Study. Ann Intern Med 2019; 170:513–520. doi: 10.7326/M18-2101. https://doi.org/10.7326/M18-2101
32
Geier DA, Kern JK, Geier MR. Childhood MMR vaccination and the incidence rate of measles infection: a ten-year longitudinal cohort study of American children born in the 1990s. BMC Pediatr 2019 Sep 10;19(1):325. DOI: 10.1186/s12887-019-1710-5. https://doi.org/0.1186/s12887-019-1710-5
33
Florida Governor’s Task Force Report on Autism Spectrum Disorders, 2008. https://www.flsenate.gov/Session/Bill/2008/1291/Analyses/20081291HHI_h1291a.HI.pdf